Lite BI for Data Visualization App
Lite BI is a simple and powerful data visualization tool that enables you to explore your data through easy-to-create charts and dashboards. Simply upload your CSV file and start visualizing your datasets in no time.
Please login to use this app.
How to use
Step 1: Upload Your Data
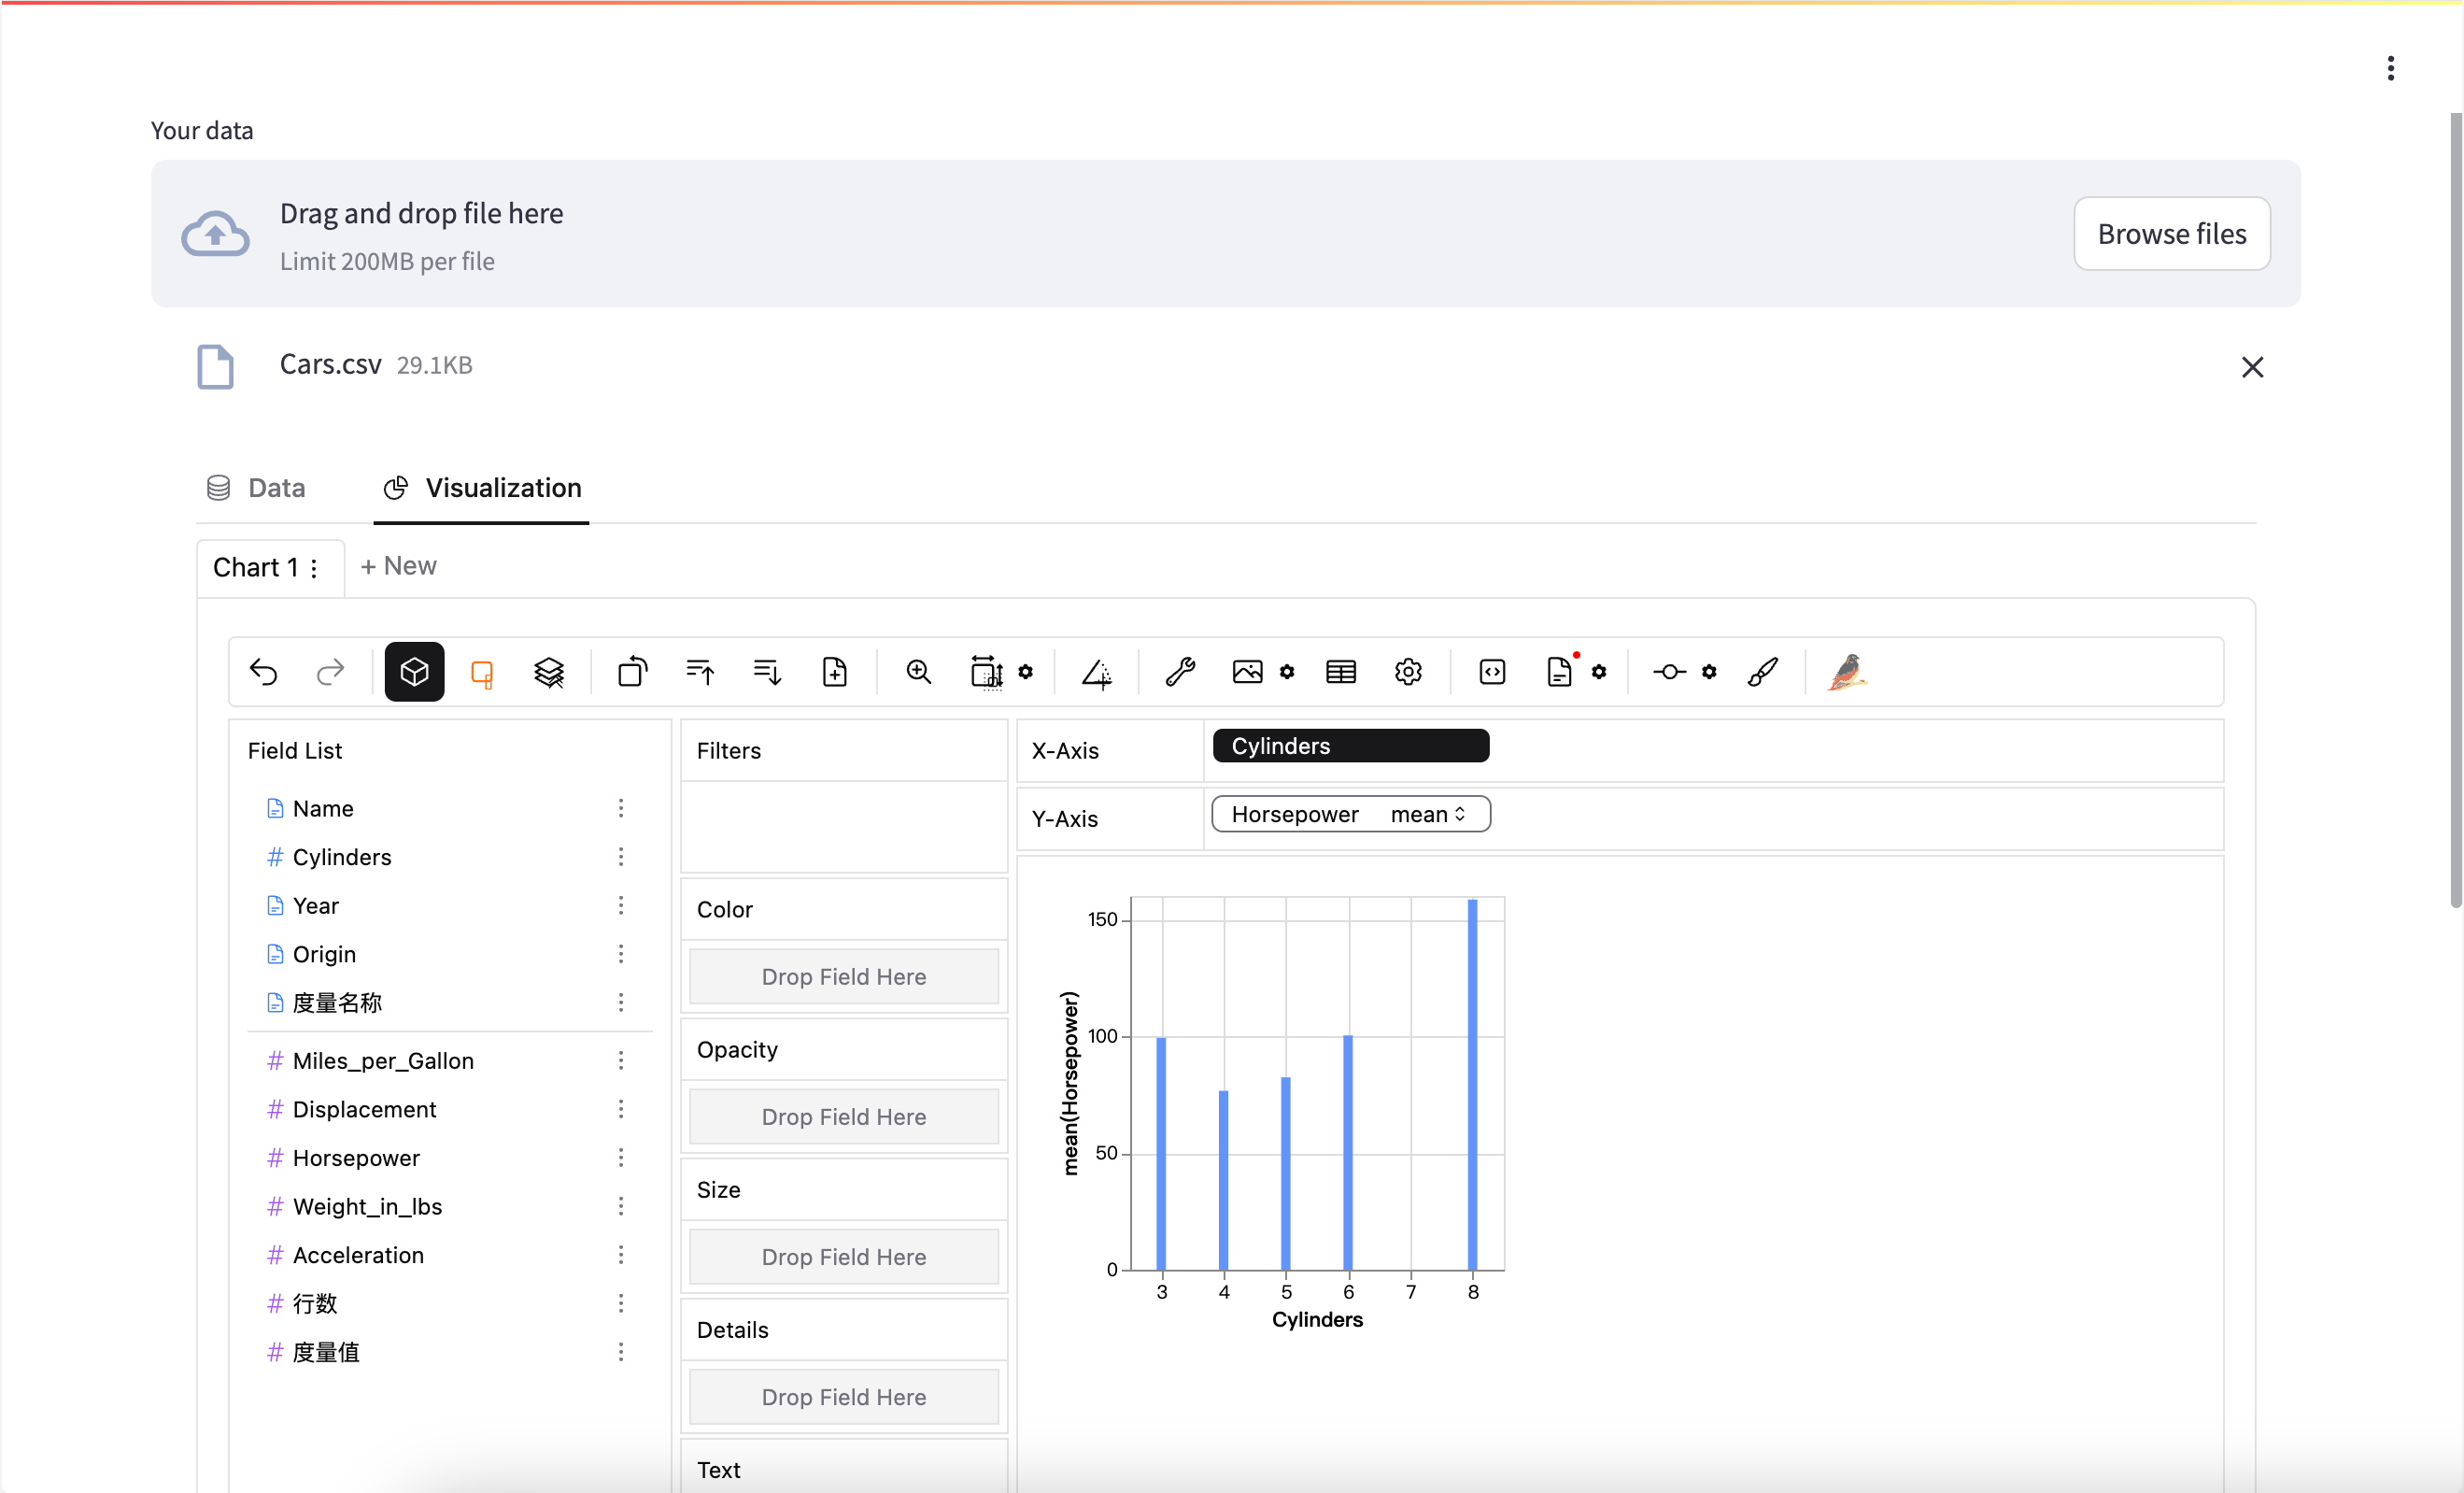
Click on the 'Your data' section or the 'Browse files' button to upload a CSV file containing your dataset.
Step 2: Explore Your Data
Once the CSV file is uploaded, Lite BI automatically processes the data and presents it in a user-friendly interface for you to start exploring.
Step 3: Create Visualizations
Use the visualization tools provided to create charts and dashboards by selecting fields and applying filters.
Step 4: Save and Share
Save your visualizations and share them with your team or stakeholders for collaboration and insights.