Build an npm Download Stats Dashboard
One prompt in lab2's AI web app builder gets you a live dashboard that pulls npm's download API and charts any package's trend. No API docs, no chart library wrangling, no deploy — a working data app at a shareable URL.
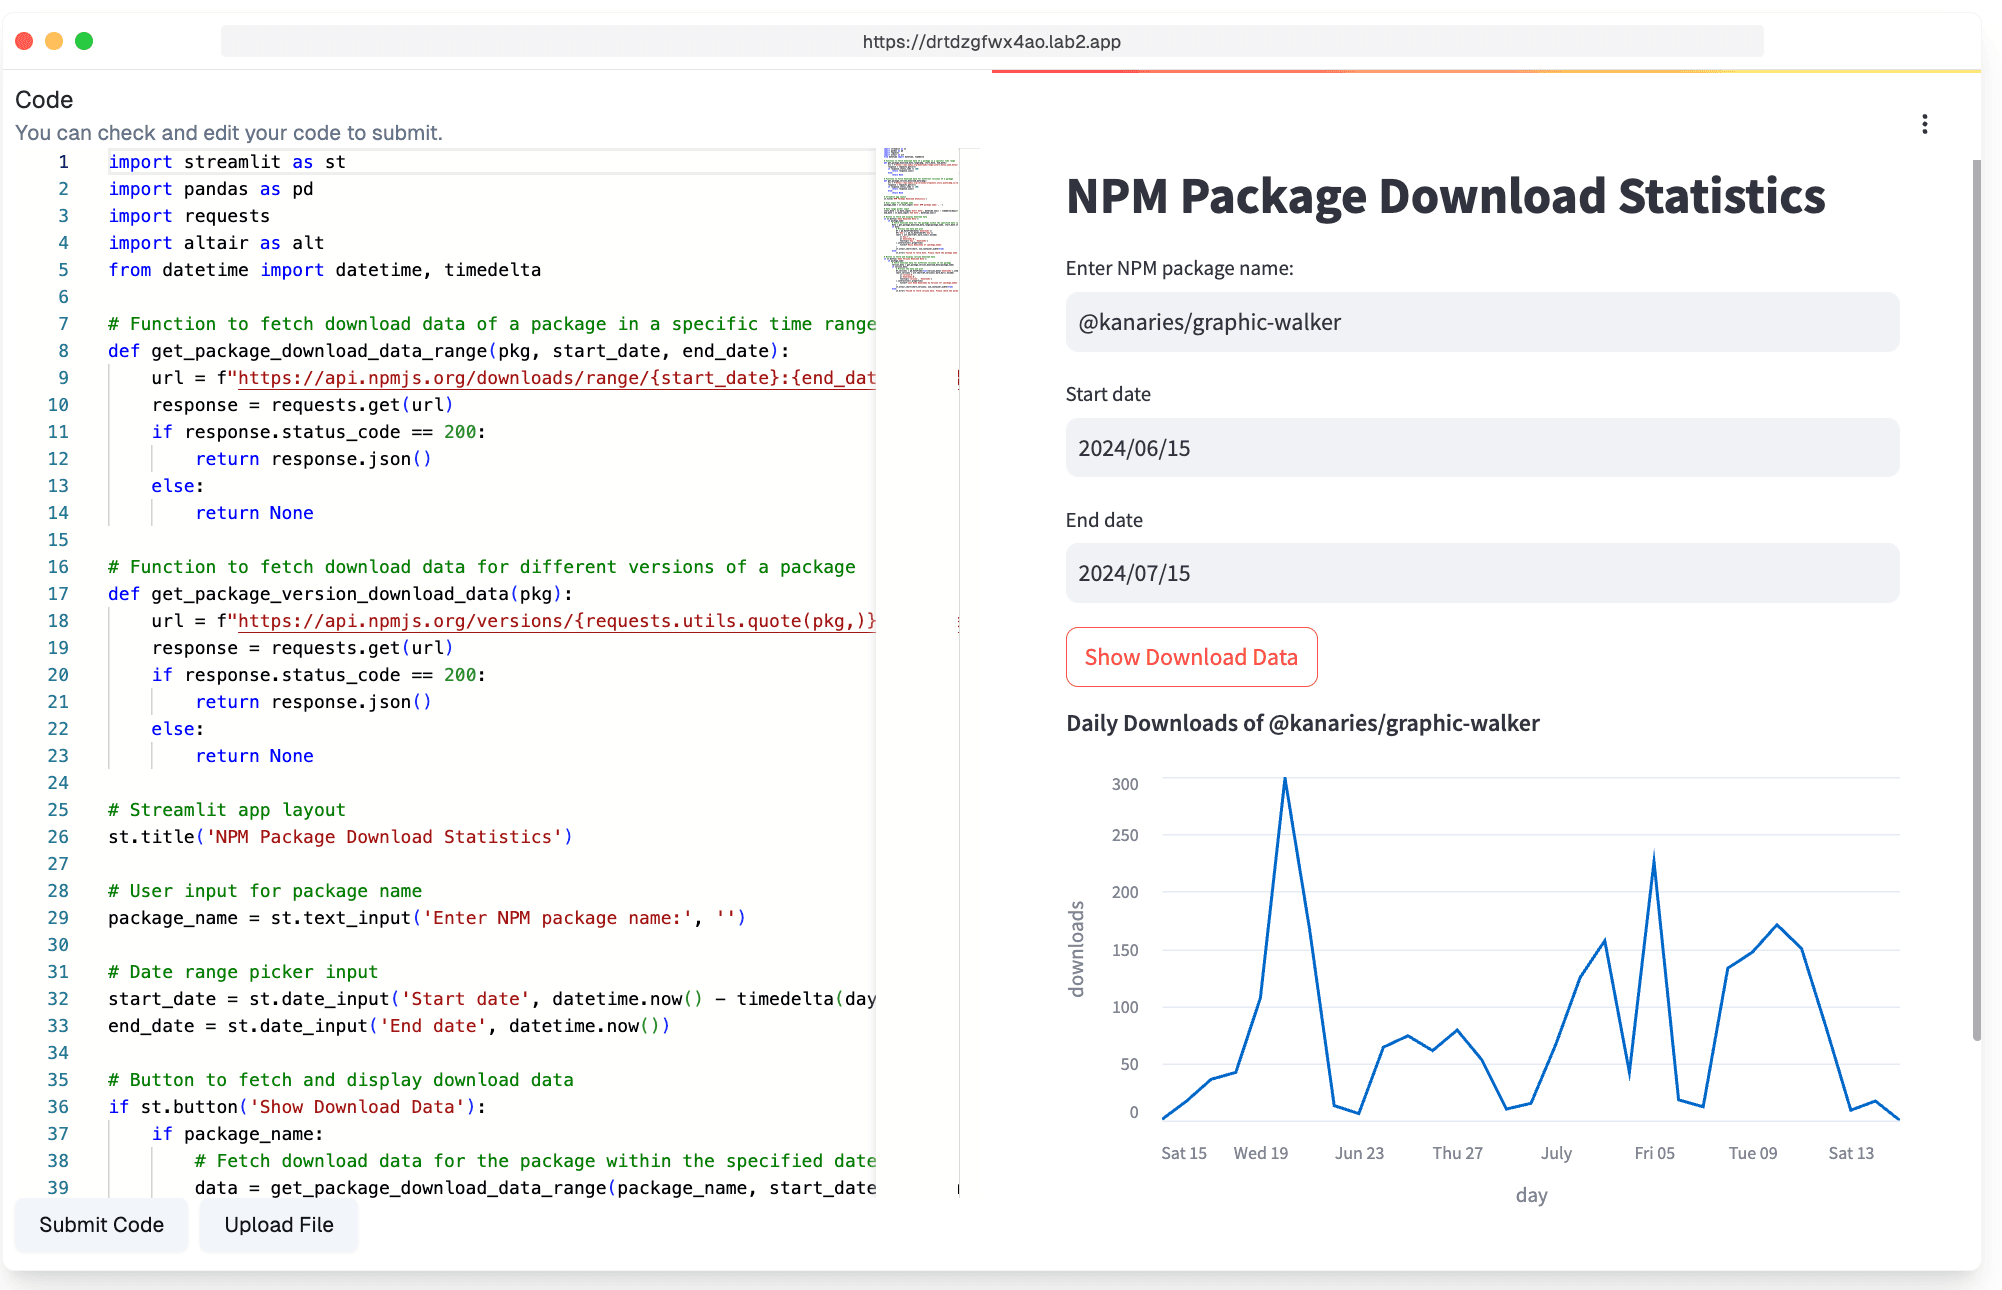
API to dashboard in one step
Every developer has wondered how a package is trending, and the data is sitting in npm's public download API. Turning it into a dashboard, though, means reading API docs, writing fetch and transform code, picking a chart library, and hosting the result. An AI web app builder does that whole arc from a sentence: describe the dashboard, and lab2 writes a data app that queries the API and charts the results.
This is the shape of a much bigger pattern — wrapping any public API in a usable interface. lab2 generates the app with Python data frameworks like Streamlit, runs it in a hosted environment, and fixes its own errors by reading the traceback. Ask for package comparisons, a date-range picker, or a downloads table, and the running app updates as you prompt.
Because the app is live at a shareable URL from the first run, a one-off curiosity becomes a tool: bookmark it, send it to your team, or publish it to the gallery. Swap npm for GitHub stars, PyPI downloads, or your own internal API and the same one-prompt workflow applies.
Two steps to a live data app
Prompt the dashboard
Ask lab2 for an app that analyzes npm package download stats. It writes the API calls, the data wrangling, and the charts, then boots the app in a hosted runtime.

Type a package, read the chart
The generated dashboard is live immediately — enter any npm package name and explore its download trend. Keep prompting to add comparisons or new views.
npm Stats Dashboard FAQ
More use cases
App generators